
Clastic Shelf Margin System Tracts
This free Teaching Tool helps visualize Sequence Stratigraphic System Tracts on a Clastic Shelf Margin.
It is a simple numerical model based on a sediment diffusion algorithm. The modeled stratigraphy is visualized over a 25 kilometer long cross section. A Chrono-Stratigraphic Chart (Wheeler Diagram) showing the superposition of the different environments of deposition is also generated.
The model input parameters are:
Number of time-steps
Initial relief (in meters per kilometer section)
Tilting (uplift and/or subsidence in meter per time-step)
The sea-level rise rate (in meters per time-step).
The amplitude of the cyclic rise and fall of sea-level (in meters).
The time-period of the cyclic rise and fall of sea-level (in time-steps).
The sediment-supply input rate (in square-meters per time-step).
The sediment-supply increment rate (in square-meters per time-step).
The amplitude of the cyclic increase-decrease of sediment-supply.
The maximum erosion rate (in meters per time-step).
The erosion wave-base (in meters below sea-level).
The offshore transport distance (in kilometers per time-step).
By interactively changing the different input parameters, the stratigraphic section is modified. This allows the user to see the effect of the different input parameters on the stratigraphic sequence patterns (see figure below).
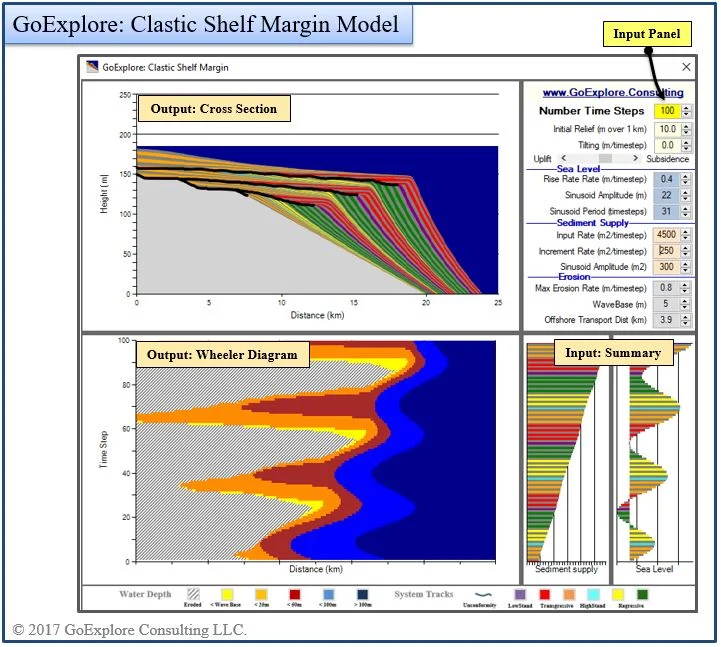
Numerical Model Clastic Shelf Edge